January 2021
Country Bloomers is a small independent gift shop in Sidmouth, Devon. The shop has a website, though only a fraction of their stock was originally displayed and available to buy online. They came to Site Review UK for help last summer. The process of adding their remaining stock continues, but this case study shows a big jump in traffic and online sales, following work in September and October 2020.
Site Review UK optimised the content and SEO settings for all of Country Bloomers’ existing product pages during the autumn, and double-checked the checkout process. Late in October, the website owner resubmitted the site’s sitemap to both Google and Bing. The following plots show significant increases in Website traffic, Website sales and Customer contacts during November and December 2020, with new customers from as far away as Glasgow.
These are great results and the owner is very happy. Work on the website continues, with new product ranges being added in time for Valentine’s Day, Mother’s Day and Easter.
Website traffic increases
Firstly, here’s a plot showing Website traffic during November and December 2020 (bold line) vs Website traffic during September and October 2020 (faded line):
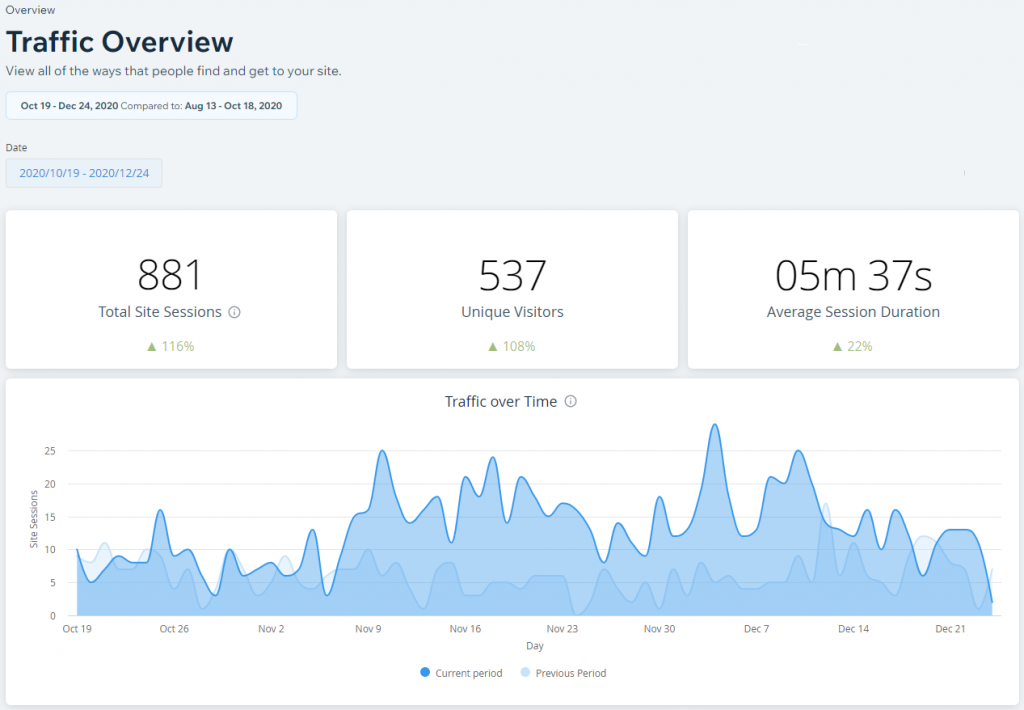
The graph and statistics show:
- A sustained period of increased traffic during November & December
- 116% increase in site sessions
- 108% increase in unique visitors
- 22% increase in session duration.
Next, we can compare 2020 with 2019. Website traffic during the whole of 2020 (bold line) vs Website traffic during the whole of 2019 (faded line):
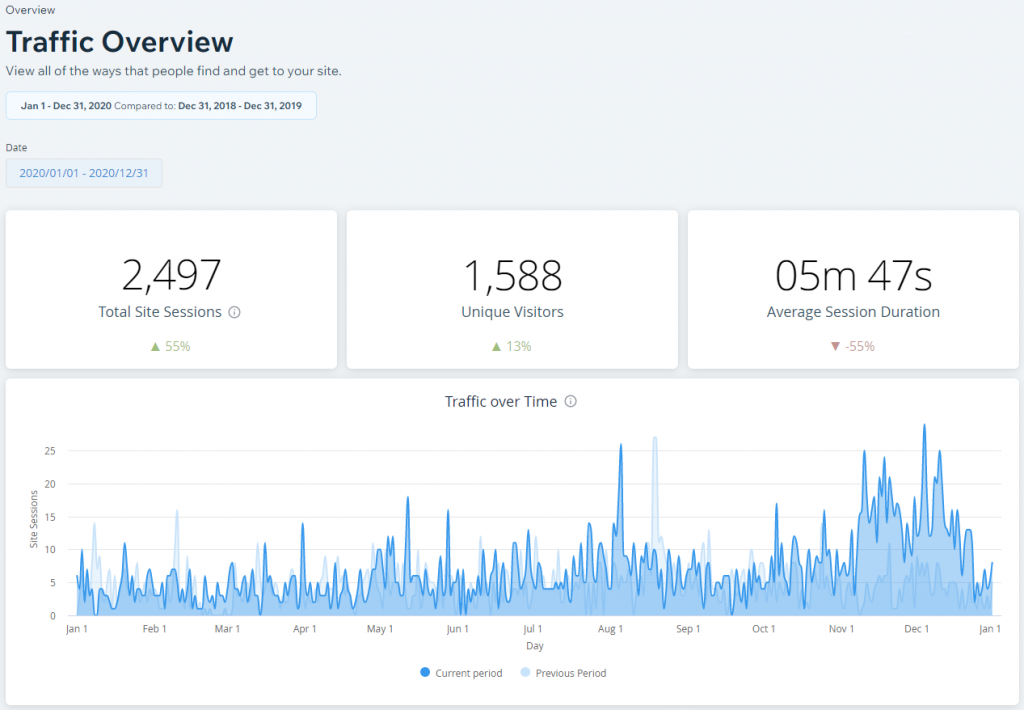
This shows:
- The same sustained period of increased traffic during November & December
- 55% increase in site sessions
- 13% increase in unique visitors
- 55% decrease in session duration.
Website traffic by Location
The website is reaching all corners of the UK and beyond. Not bad for an independent trader based solely in East Devon. Website traffic by location in the UK during November and December 2020:
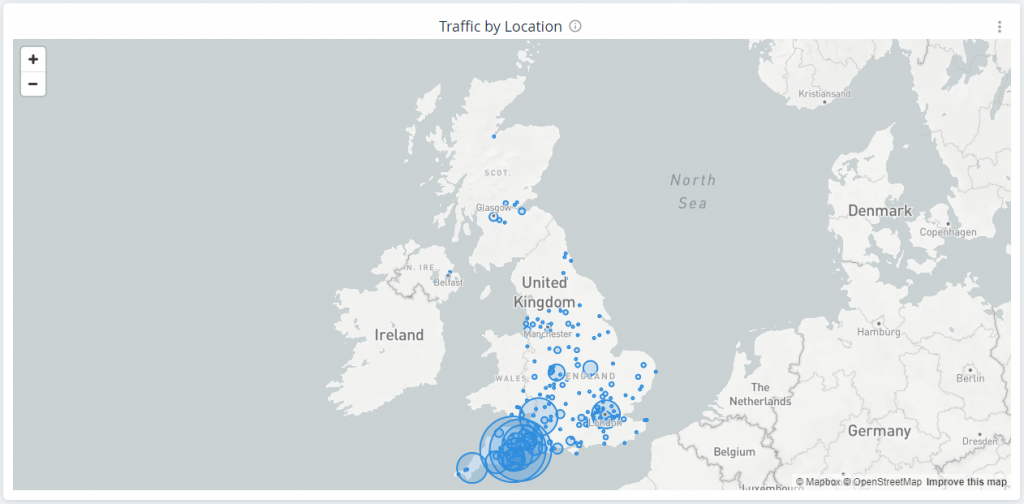
This map shows:
- Majority of sessions within Devon
- Several sessions from Bristol, London and Cornwall
- Furthest UK visitor from Inverness.
Website traffic by location worldwide during November and December 2020:
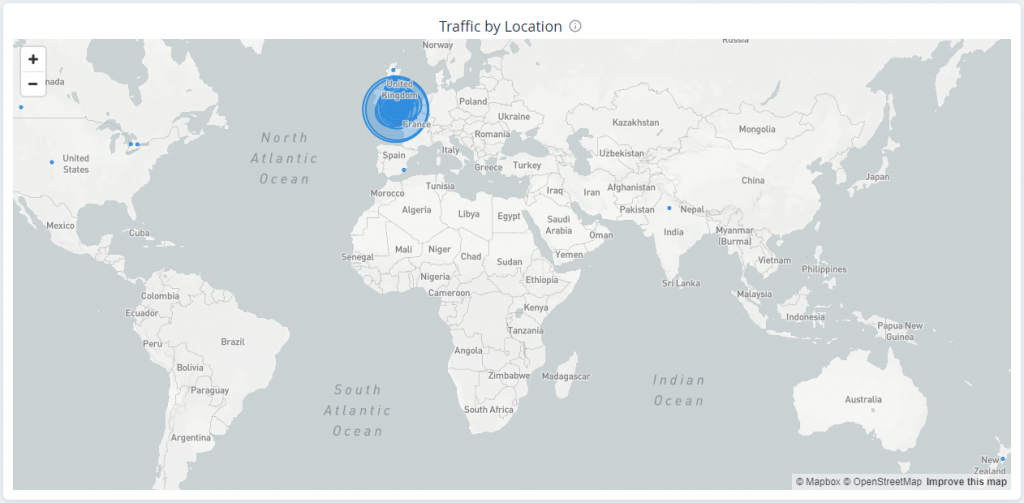
Here we see:
- Website visitors in the US and Canada
- Furthest visitor from New Zealand.
Website traffic by First page viewed
Improvements to the website’s SEO settings for each product page may account for these increases. Let’s look at Website traffic by first page viewed during November and December 2020 (bold bars) vs Website traffic by first page viewed during September and October 2020 (faded bars):
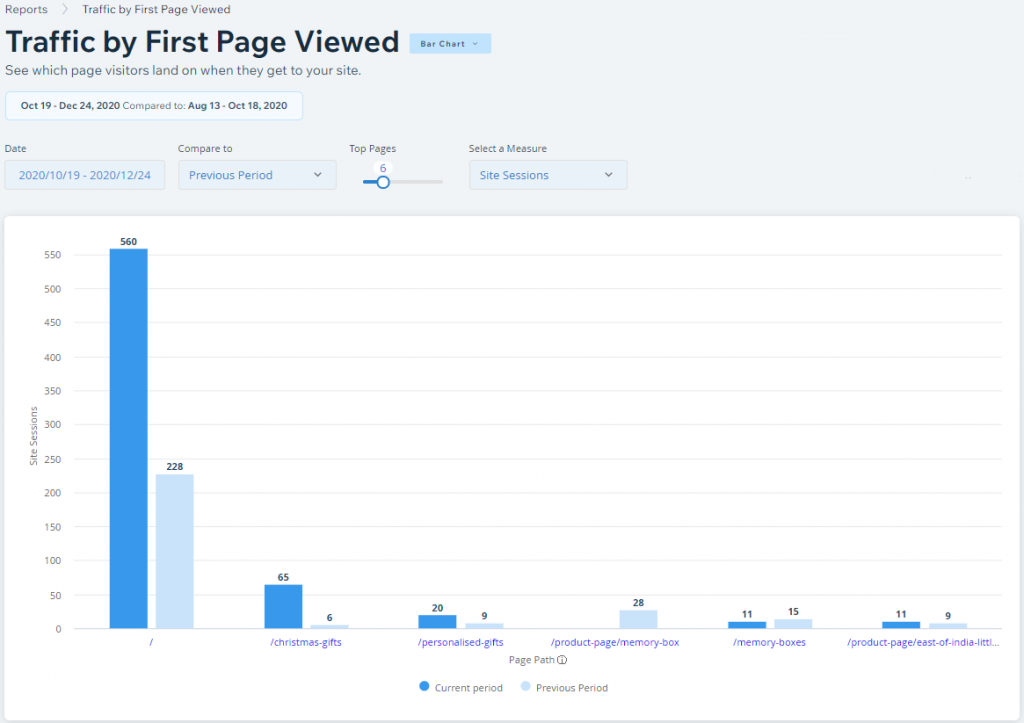
The first of these two bars show:
- 145% increase of traffic via the homepage
- 983% increase of traffic via the Christmas gifts page.
We’ll continue to monitor this, though some page names have changed from their previous addresses.
Website sales increases
Now the all-important sales revenues. I have removed actual figures from these two plots. Website sales revenue during November and December 2020 (bold line) vs Website sales revenue during September and October 2020 (faded line):
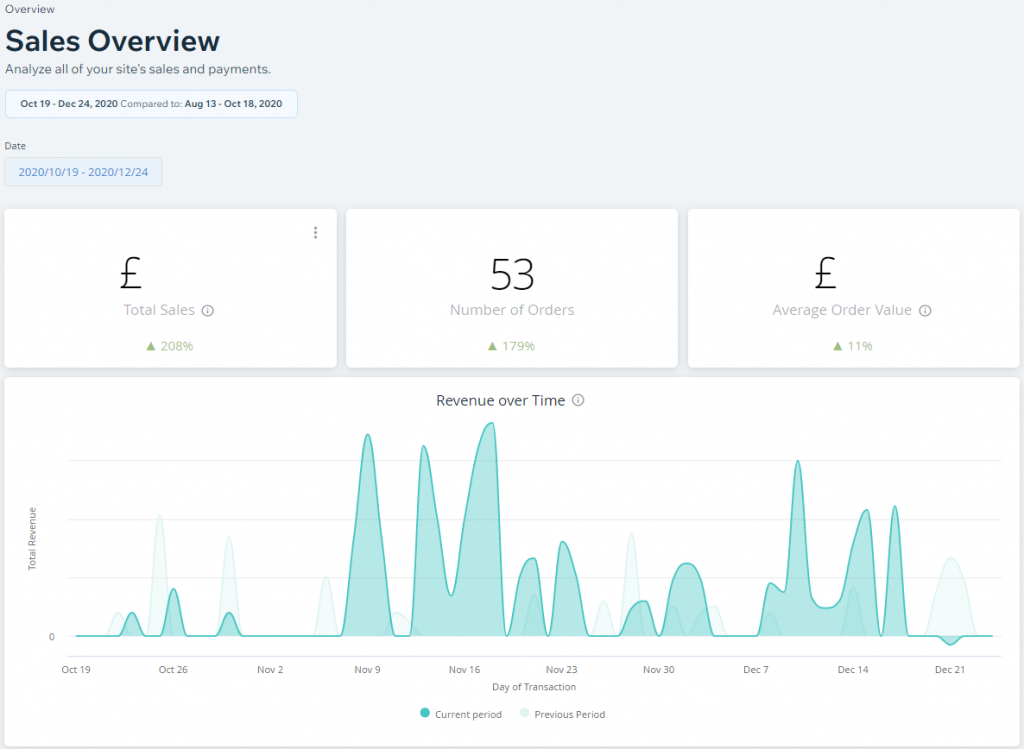
This graph and statistics show:
- A sustained period of increased sales during November & December
- 208% increase in total sales
- 179% increase in number of orders
- 11% increase in order value.
Next, we can compare 2020 with 2019. Website sales revenue during the whole of 2020 (bold line) vs Website sales revenue during the whole of 2019 (faded line):
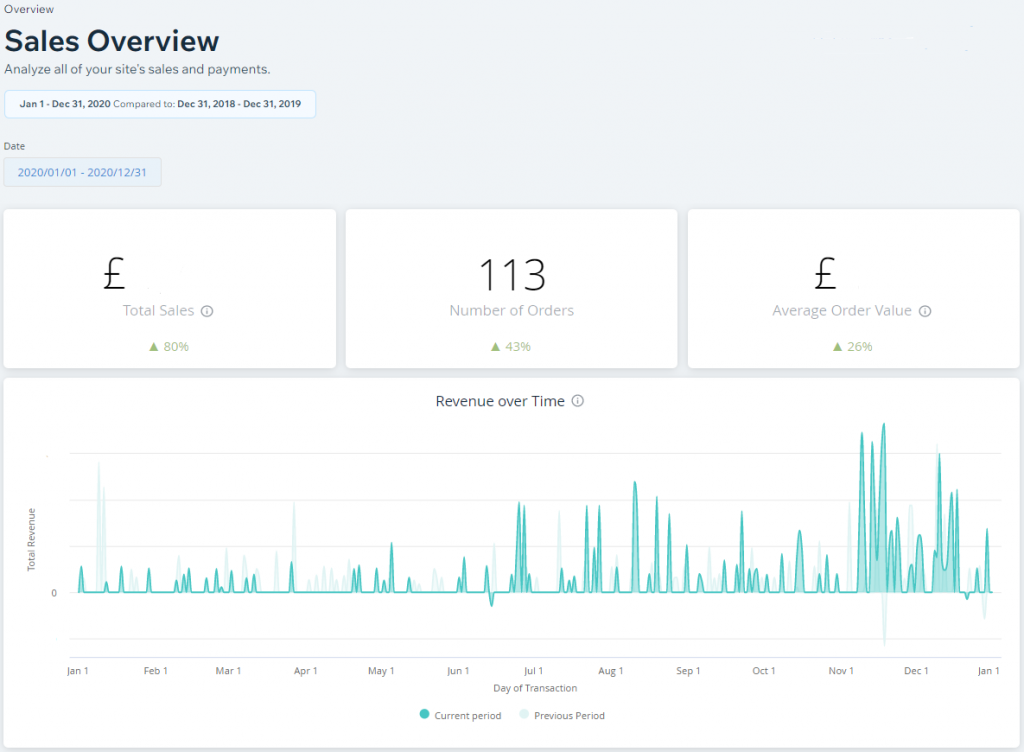
This plot shows:
- The same sustained period of increased sales during November & December
- 80% increase in total sales
- 43% increase in number of orders
- 26% increase in order value.
Website sales by Location
Let’s look at the location of people actually making purchases. Website sales by location during November and December 2020:
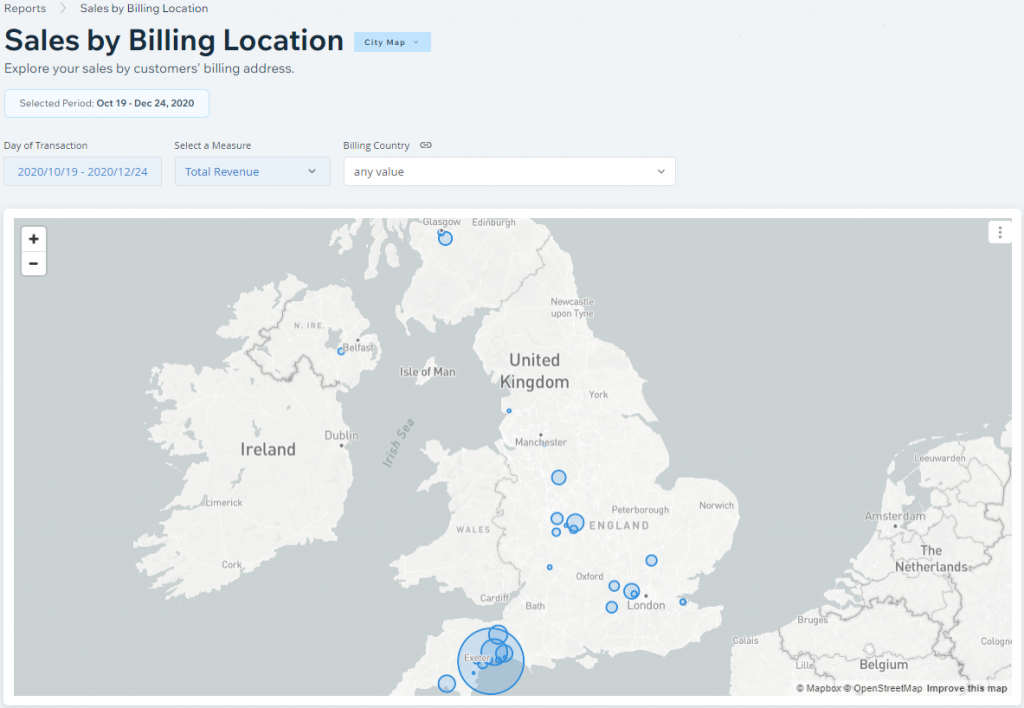
Here we see:
- Majority of sales within Devon
- Several sales to customers in London and the Midlands
- Furthest customer from Glasgow.
Website sales by location during the whole of 2020:
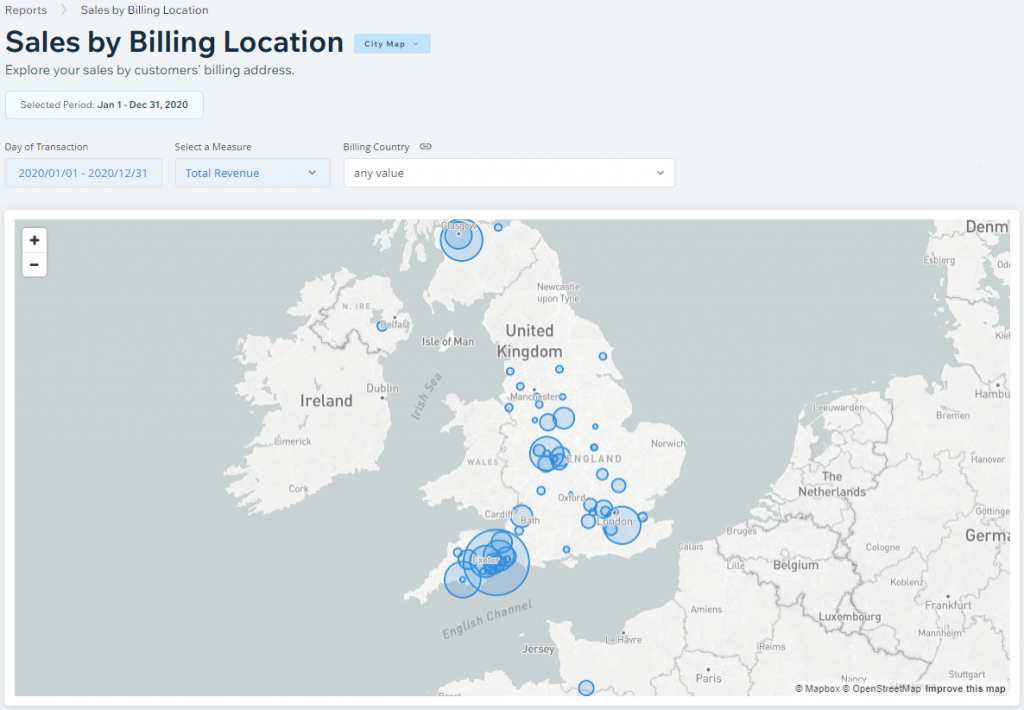
Over the whole year, we see:
- Majority of sales within Devon
- Several sales to customers in London, the Midlands and Scotland
- One customer in northern France.
Customer contacts increases
Finally for this case study, we look at the increase in customer contacts. Website customer contacts during November and December 2020 (bold line) vs Website customer contacts during September and October 2020 (faded line):
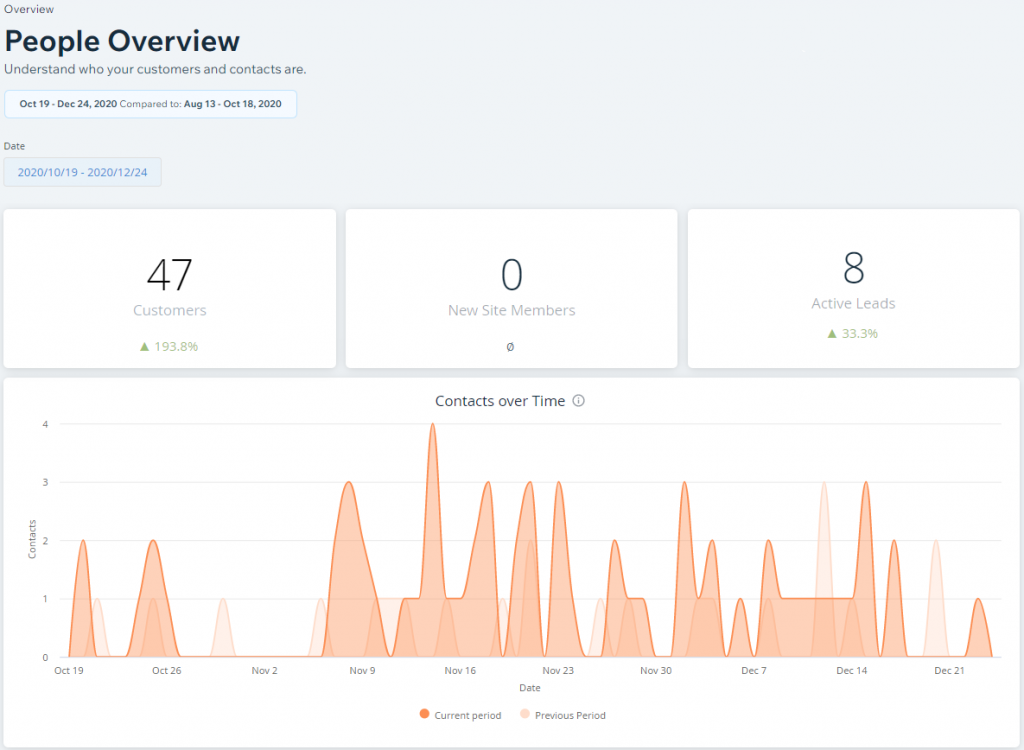
This graph and statistics show:
- A sustained period of increased contacts during November & December
- 194% increase in customers
- 33% increase in active leads.
And so to the final plot, comparing 2020 with 2019. Website customer contacts during the whole of 2020 (bold line) vs Website customer contacts during the whole of 2019 (faded line):
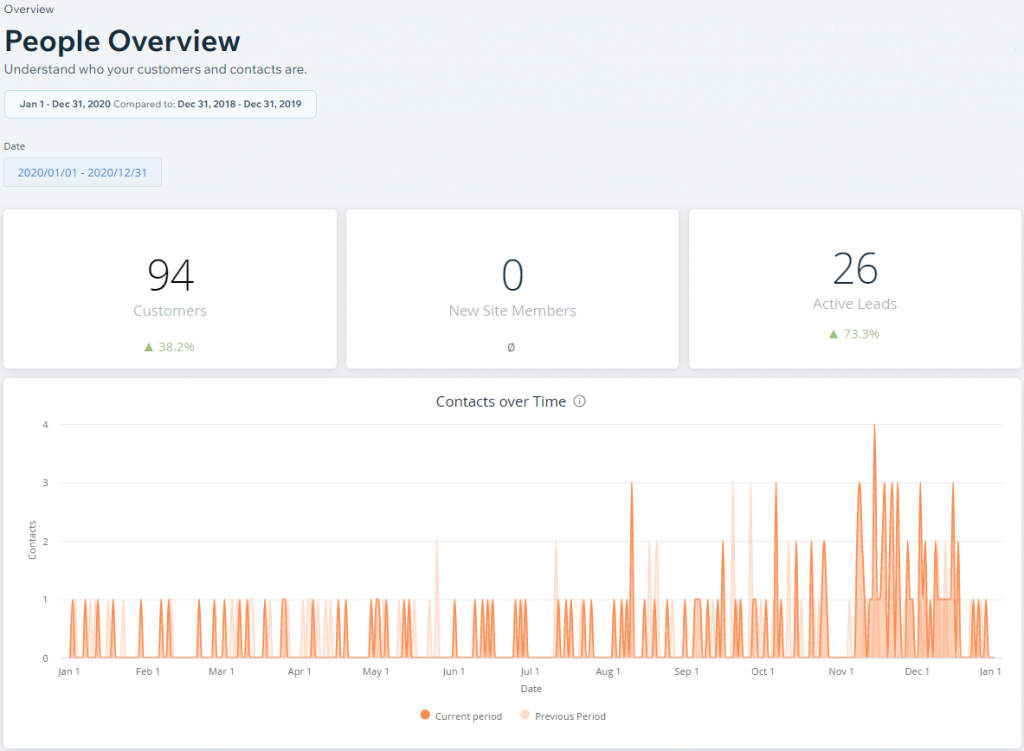
Here we see:
- The same sustained period of increased contacts during November & December
- 38% increase in customers
- 73% increase in active leads.
Can Site Review UK help your website too?
Your small business’s 2021 recovery may well depend on your website. Please get in touch via my Contact form.